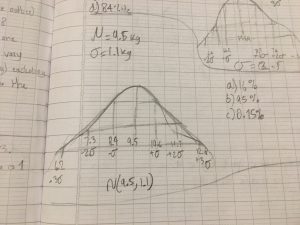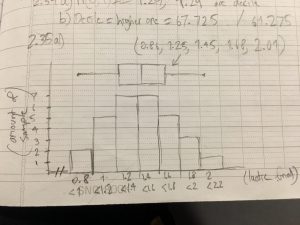
I love and enjoy learning math. This year, I get exposed to a completely new area of math, statistics. I find statistics to be very different from other math subjects such as algebra and geometry. Most of the time, in stats, there’s no such a thing as one correct answer, it really depends on your explanation and evidence using the graph and/or data. Students that learn statistic will take the 2018 AP Statistic Exam. In the first block of statistics, I learned about different ways to display and describe data using graphs, charts, and numbers. I also learned about density curve. The area under the density curve is always equal to one, and it represents the probability of a given condition.